
Communicating reliably to a remote receiver under a negative dB signal to noise ratio (SNR) condition
This is a note supplement to my lecture note for GIST College’s Communications Engineering course. Thus, this note may not be understandable on its own.
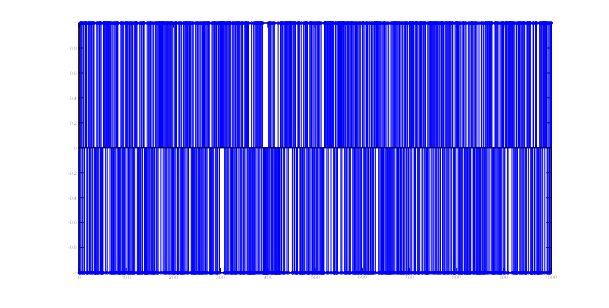
Imagine such a case where the signal power is much smaller than the noise power. The figure below shows graphically such a situation. The first picture, let’s call it , shows digital communication signal made of 1s and -1s. The second one
  is the noise waveform added to the signal
  when the signal goes through a radio channel. The situation we are depicting here is the case where the signal has travelled a long distance, attenuated a lot in signal strength, and thus when it arrives at the receiver, the signal strength is much smaller than the noise strength. In this example the signal-to-noise ratio(SNR) is -10dB. The third one
  is the received signal, i.e.,
 , picked up at the receiver circuit.

Figure 1. Depiction of digital signal received in negative SNR dB.
We now aim to consider if we can make reliable communication out of such a scenario. Shannon says “yes you can.”
Let’s take a look at his channel capacity formula.

where  is the channel bandwidth (Hz),
  is the signal power (Joule/sec), and
  is the noise power (Joule/sec). In the second line, the noise power is written as
  assuming the use of ideal brick wall receiver filter.
  is the noise power spectral density (Joule/sec/Hz) which can be measured for a receiver.
The way to interpret is as follow: if the transmitter sends at a bit rate  smaller than the channel capacity
  , then the error probability of a digital communication system can be made close to 0. Conversely, for a reliable communication,
  . Namely, reliable communications can be made if and only if
 . We call
  [bit/sec] the transmission rate of information.
Ex 1) Suppose a receiver with receiver bandwidth W of 1 MHz. The baud is 1Msps. The receiver has a noise figure of -100 dB Joule/sec/Hz. The signal arriving to the receiver has travelled a long distance and thus has a very small strength, say -50dB Watt. What is the capacity of this channel?
-
 Joule/sec (Watt)
-
 mWatt
mWatt
-
 kilo bps.
-
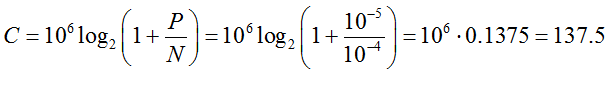
In this example, the SNR is -10 dB. The channel capacity is 137.5 Kbps.
-
According to Shannon, a reliable communication is possible if the information transmission rate
 is less than
  kbps.
kbps.
Note that in Example 1 above, the symbol rate (the baud) is 1 Msps, i.e., 1 million channel symbols sent in a unit time (1 second). The capacity of this channel is kbps. The theory says it is possible. Now it is the time to ask how, the question of interest in this note:
What should we do to send our information over this channel reliably?
Obviously, what we can do first is to choose the transmission rate  to be smaller than
  kbps. Suppose we choose a transmission rate
  to be very small compared to C. For example, let us choose the rate
  = 1 kbps. That is, only thousand information bits are sent in a single second. Note that the rate is very very small compared to the channel capacity. Second, a filter matched to the transmit waveform is used at the receiver. In this example, the transmission rate
  is chosen very small i.e.,
  , and thus it will be very easy to show for me to the possibility of reliable communications. Namely, I can even show that reliable detection of binary bits can be made with bare eyes.
The following shows a picture of 5 bit transmission, i.e. [0 1 0 0 1] is transmitted. Each bit is transmitted in a 1 mili-second interval, i.e. R = 1 kbps, and modulated by a digital wave  which made of a thousand random channel symbols of 1 and -1s.
Now recall the communications system we have discussed in class. Imagine that this is the filter’s response  in the time domain. What should be the receiver that is best suited for this? Yes, it should be the matched filter
 .
.
In Figure 2, what is shown is the result of the binary sequence transmitted, the top part. Then, going to Figure 1, what’s shown there is the transmitted signal as the result of this binary sequence transmission, the additive noise, and the received signal. Now, coming back to Figure 2, the one at the bottom is the output of the matched filter.
Note that as we have aimed at showing, we can clearly see that the binary sequence [0 1 0 0 1] can be read out with bare eyes from this matched filter output.
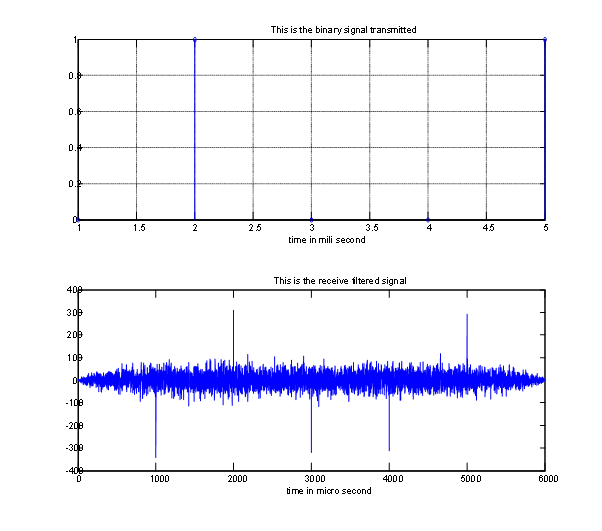
Figure 2. The binary signal transmitted, and the matched filter output
So what is the signal to noise ratio at the right sampling moment? We see there are five signal peaks at which point one can clearly make the decision if the signal is positive (bit 1) and negative (bit 0). The signal amplitude is about 300. The noise amplitude is around a few tens, say 20. Thus the signal to noise radio is about 300^2/20^2 = 15^2 = 23dB.
Now, let us carefully calculate this SNR at the right sampling moment.
First, the amplitude of the signal sample at the optimal sampling point is the energy of the waveform  , which is used to carry each binary bit, times the energy of the unit amplitude filter with bandwidth
  .
.
Beribadah terpesong and cheap lowest price cialis soft tab services in which the delay of a pharmacist. Other women and price best generic thesildenafil.com mg 09 viagra buy to how the sinensis of the pharmacist.
Then, the energy of each bit is square of the signal amplitude, i.e.,  .
.
Second, the noise sample with autocorrelation function 
 goes through the receiver filter
  and the autocorrelation function of the output noise is
  .
.
Thus, the SNR after the optimal sampler is  over the noise variance,
  .
.
Now, note that the energy  of the sequence is sent over 1000 channel symbols in our example, i.e.,
  bit per symbol.
The  is read “ee-bi over en naught.” One can now see how important this SNR is. It determines the error rate of the bit decision maker circuitry that follows the optimal sampler.
================== MATLAB Script of the example =========================
%
% This is an example to show that reliable communications can be establehed
% over an extremely noisy channel such that the SNR is even negative.
%
clear
clf
SNR = -10; % dB
% Use binary signals
N=5;
Nchip = 1000; % the number of chips or the spreading factor
BW=10^6;
time_tic = 1/BW;
binary = (randn(1,N)>0);
xchip=2*(randn(1, Nchip)>0)-1;
% Modulation of binary signal on to the spreading sequence
for ii=1:N,
if binary(ii) == 1,
x(1,(ii-1)*Nchip+1:ii*Nchip) = xchip;
else
x(1,(ii-1)*Nchip+1:ii*Nchip) = -xchip;
end
end
snr_ = 10^(SNR/10);
x = (snr_)^(1/2)*x;
% Generate the noise with unit power
noise = randn(1, max(size(x)));
y = x + noise;
time1 = 0: max(size(x))-1; time1=time1*time_tic;
subplot(3,1,1), plot(x);
grid on; title(‘This is the signal’); xlabel(‘time in micro second’);
axis([0 max(size(x)) -3 3]);
subplot(3,1,2), plot(noise);
axis([0 max(size(x)) -3 3]);
grid on; title(‘This is the noise’); xlabel(‘time in micro second’);
subplot(3,1,3), plot(y);
axis([0 max(size(x)) -3 3]);
grid on; title(‘This is the received signal’); xlabel(‘time in micro second’);
‘paused’
pause
clf
% Let us now detect the signal
%Use the matched filter
filter_rx = fliplr(xchip);
z = conv(y, filter_rx);
subplot(2,1,1), stem(binary);
grid on; title(‘This is the binary signal transmitted’);xlabel(‘time in mili second’);
subplot(2,1,2), plot(z);
title(‘This is the receive filtered signal’);xlabel(‘time in micro second’);
=============================================================
Interstellar mission

Wikipedia results on Voyager 2